
A fixed index annuity is an insurance product that allows your savings to grow in a tax-deferred manner. The key differentiator of a fixed index annuity from other types of annuities is that the growth of your savings is linked to a stock market index, while your downside is limited.
Annuities are used in two phases: an accumulation phase and a withdrawal phase. During the accumulation phase, you put money into an annuity and it grows in a tax-deferred way. During the withdrawal phase, you can choose to take money out (typically as a lump sum or a series of monthly payments). What’s s unique about fixed index annuities is the way they allow your savings to grow with a stock market index during the accumulation phase. This makes it similar to a fixed-income instrument (such as a bond) that protects your principal, but instead the interest return is linked to a stock market index.
Upside Limitations
During an annuity’s accumulation phase, the return of a fixed index annuity is linked to a stock market index. Examples of stock market indexes that are commonly used are the S&P 500 Index, the Russell 3000, and the Dow Jones Industrial Index. The downside for fixed index annuities is limited in such a way that you are guaranteed not to lose your original principal. The tradeoff is that, in return for this guarantee, the insurance company places limitations on the growth you can receive from the linked stock market indexes.
In many cases, the annuity’s growth is subject to caps, spreads, and participation rates. These features modify how changes in the stock market index impact the growth in your savings. The way insurance companies place these limitations on your stock market index upside can be complex and may cause you to have unrealistic expectations of the returns.
Let’s examine each of these crediting features and how they work
Caps
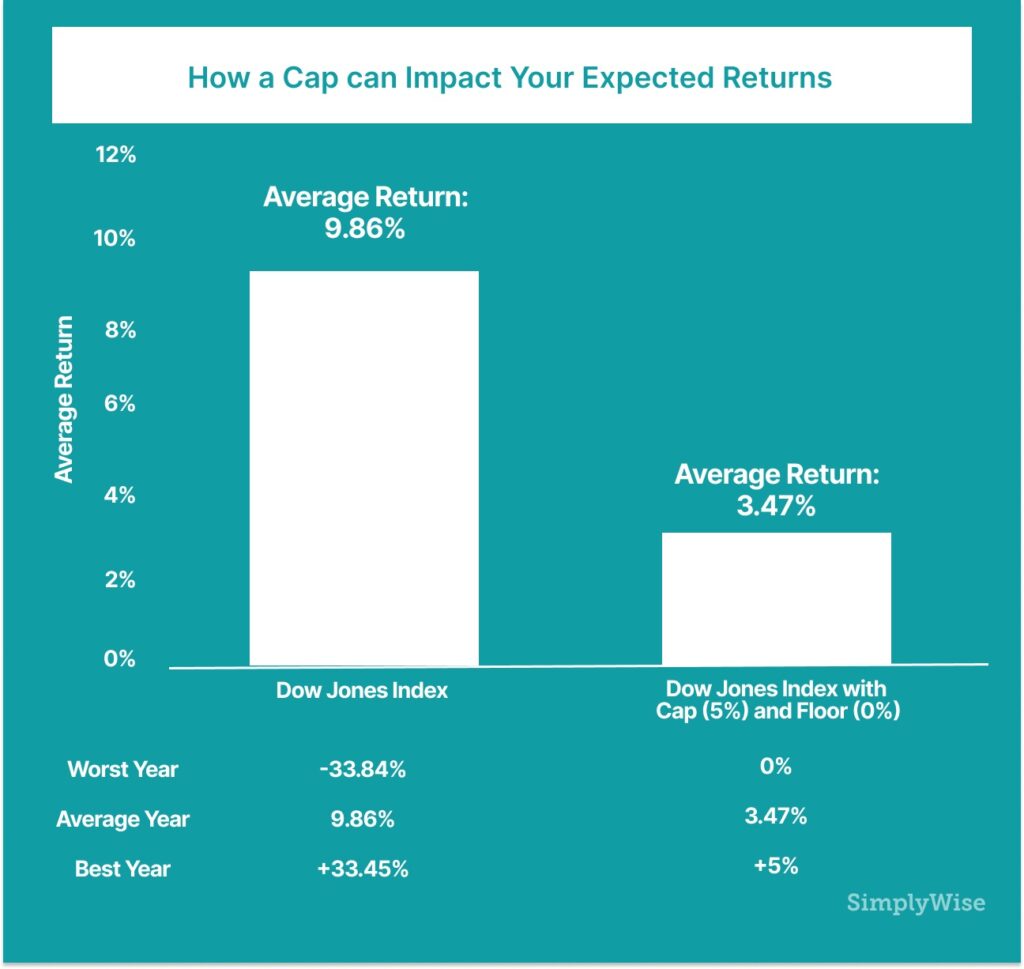
A cap is a limit of how much of the stock market index return you will receive over a specified crediting period (typically a year). For example, let’s say you purchase a fixed index annuity that credits you each year with the return of the S&P 500 Index for the prior year up to a cap of 5%. You put $10,000 into the annuity on Jan. 1, 2018, and by Jan. 1, 2019, the S&P 500 Index has returned 10%. In this example, on Jan. 1, 2019, you will be credited 5% of your principal ($500) in interest instead of the full 10% return of the S&P 500.
What sort of returns should you expect from a fixed index annuity with a cap of 5%? Let’s look at the last 40 years of data for the Dow Jones Industrial Index. From 1980 to the present, this index has returned an average of 9.86%, with the worst year of return at -33.84% and the best year of return at +33.45%. Let’s take each calendar year’s return and subject it to a minimum return of 0% and a cap of 5%. The resulting return stream has an average return of 3.47%, with a best year of 5% (the cap) and a worst year of 0% (the floor). The simulation shows that with a cap of 5%, if the future looks like the past 40 years, you should expect a yearly return that is roughly one-third of the return of the Dow Jones Index without those restrictions.
Participation Rate
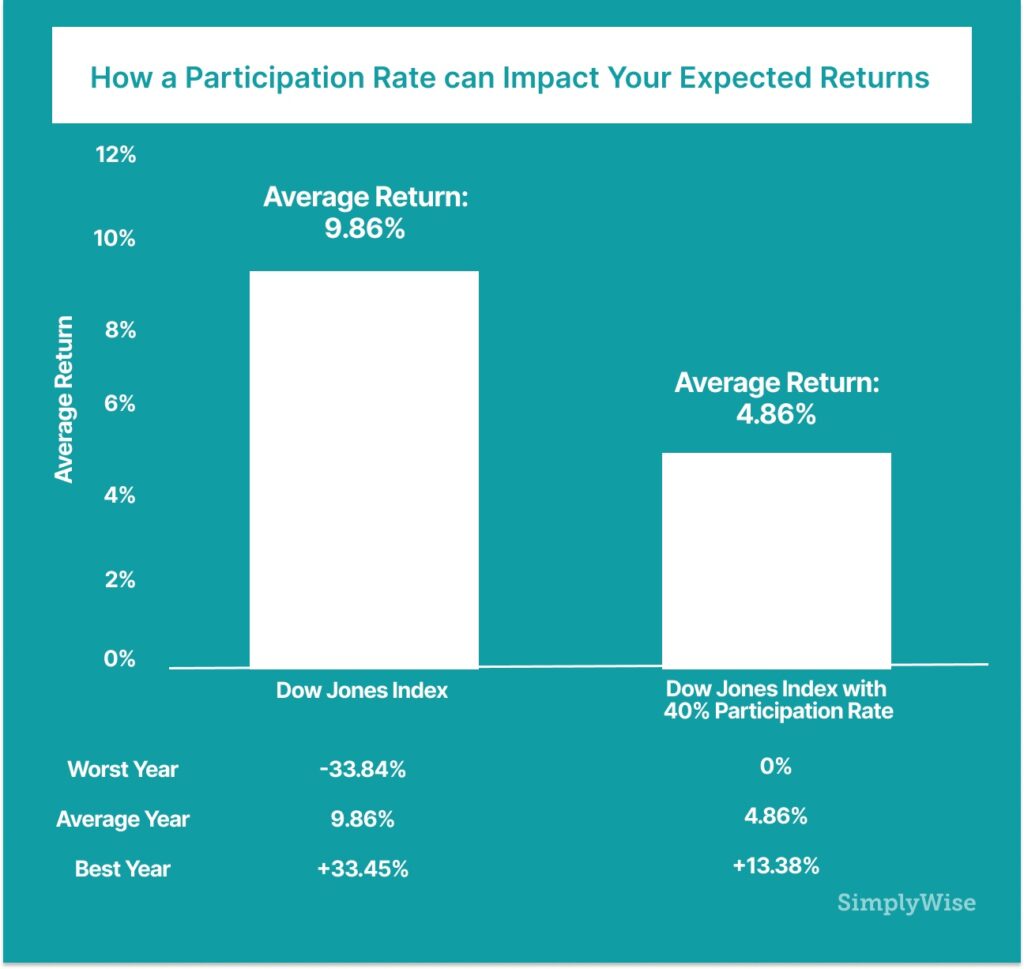
The participation rate is the proportion of any index’s gain that is credited to your account. For example, let’s say you purchase a fixed index annuity that credits you each year with 50% participation in the S&P 500 Index’s return from the prior year. Let’s say you put $10,000 into the annuity on Jan. 1, 2018, and by Jan. 1, 2019, the S&P 500 Index has returned 10%. On Jan. 1, 2019, you will be credited 5% of your principal ($500) in interest instead of the full 10% return of the S&P 500.
What sort of returns should you expect from a fixed index annuity with a participation rate of 50%? Let’s look at the last 40 years of data for the Dow Jones Industrial Index. As we noted before, from 1980 to the present, this index has returned an average of 9.86% with a worst year of -33.84% and a best year of +33.45%. Let’s take each calendar year’s return and subject it to a minimum return of 0% and an upside participation rate of 40%. The resulting return stream has an average return of 4.86%, with a best year of 13.38% and a worst year of 0% (the floor). The example shows that with a participation rate of 40%, assuming the future looks like the past, you should expect a return that is roughly half of the return of the Dow Jones Index without those restrictions.
Spread
The spread is a percentage reduction of how much interest is credited to your account over a specific period of time (usually a year). For example, let’s say you purchase a fixed index annuity that credits you each year with the return of the S&P 500 Index for the prior year with a spread of 5%. You put $10,000 into the annuity in Jan. 2018, and by Jan. 2019, the S&P 500 Index has returned 10%. In that case, in Jan. 2019, the 5% spread would be subtracted from the 10% return, so you will be credited 5% in interest instead of the full 10% return of the S&P 500.
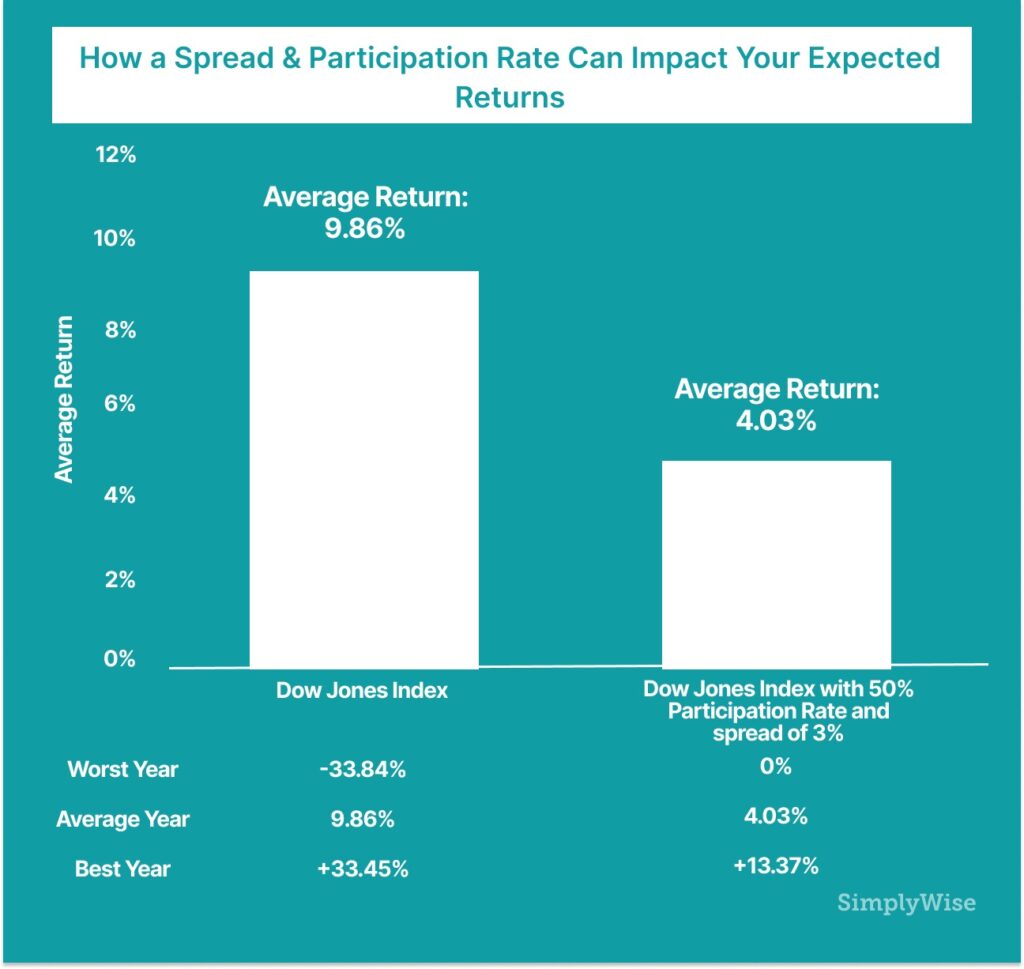
Some fixed index annuities have both a spread and a participation rate. For example, you might buy a fixed index annuity that has a participation rate of 50% and a spread of 3%. Let’s say you put $10,000 into the annuity in Jan. 2018, and by Jan. 2019, the S&P 500 Index has returned 10%. In that case, in Jan. 2019, the 10% return would be multiplied by the participation rate of 90%, then subtract the 3% spread, so you will be credited 6% in interest instead of the full 10% return of the S&P 500.
What sort of returns should you expect from a fixed index annuity with a participation rate and a spread? Let’s look at the last 40 years of data for the Dow Jones Industrial Index. As we noted before, from 1980 to the present, this index has returned an average of 9.86% with a worst year of -33.84% and a best year of +33.45%. Let’s take each calendar year’s return and subject it to a minimum return of 0% and an upside participation rate of 50% with a spread of 3%. The resulting return stream has an average return of 4.03%, with a best year of 13.37% and a worst year of 0% (the floor). The example shows that with a participation rate of 50% with a spread of 3%, assuming the future looks like the past, you should expect a return that is roughly half of the return of the Dow Jones Index without those restrictions.
Crediting Methods
The crediting method refers to the time frame over which the insurance company credits the interest you’ve earned.
For example, you may purchase a 10-year fixed index annuity where the insurance company will credit you interest every year on the anniversary of the day you opened your account. The crediting would happen in accordance with the participation rate, spread, or cap defined by the insurer. In this case, the crediting period is one year and the crediting method is “point-to-point”. All that means is that the crediting will be based on the change in the index from a point to another point a year later.
Typically, with a fixed index annuity, the insurer will specify the participation rate, spread, or cap for only a year in advance. This means that if you buy a 10-year fixed index annuity, the insurer will only then specify the terms for the second year after the first year is up. This creates a new source of uncertainty in the returns you can expect; not only do you not know what the market’s returns are going to be, but you also don’t know ahead of time how much of that return you’ll be able to participate in.
Expenses
Most fixed index annuities have no explicit fees (unless you choose to include an income rider). The reason they have no fees is not because insurers don’t incur any expenses to run them, but because the expenses are hidden from the customer.
Consider, for example, when you buy a certificate of deposit from a bank, you give the bank your money and the bank pays you an interest rate over a period of time. A CD rarely has a fee associated with it. The way the bank makes money is by taking your money, investing it in bonds that pay interest, and then sharing some (but not all) of the interest payments with you.
A fixed index annuity works the same way. The insurance company takes your money, uses it to buy bonds and stock index call options, as well as to pay the agent who sold you the product, and shares most (but not all) of the return with you. The amount of your money that’s paid to the agent can be substantial; fixed index annuities pay some of the highest commissions to agents and brokers (between 5% to 10% of your money). While you do not pay for this commission up front, it lowers the growth rate of your savings by limiting how much money the insurer can use to buy bonds and call options.
Dividends
Most indices that are used for crediting in fixed index annuities do not include the return of dividends. Let’s examine what this means.
If you closely examine common indexes such as the S&P 500 or the Dow Jones Industrial Average, you’ll notice they are price indices. This means that they reflect the prices of the stocks within the index. If you were to actually buy all the stocks in the S&P Index and hold them for 10 years, your return would likely be greater than the return of the S&P 500 Index over those 10 years. That is because some of the stocks in the index would pay dividends over the course of those years, which would add to your returns. The value of those dividends are not included in the price of the stock. In turn, this means the benefits of capturing these dividends as a buy and hold investor are not captured by price indices such as the S&P 500 Index or the Dow Jones.
So even if a fixed index annuity gave you 100% participation in the Dow Jones Industrial Average Index, with no caps or spreads, your returns would likely be lower than if you bought a Dow Jones Industrial ETF or index fund. One way to think about this is that if your only goal is to maximize the long-term return of your investment in the stock market, it’s very hard to beat a low-cost index fund or ETF.
Tax Deferral
Another key feature of a fixed index annuity is tax deferral. This means that any growth in your savings is not taxed until the money is withdrawn. If your tax rate when you withdraw money is lower than your tax rate today, you will save significantly on taxes. For a thorough examination of tax deferral and whether it can potentially save you money, take a look at our ultimate guide to tax deferrals.
Liquidity and Surrender Charges
Most annuities (not just fixed index annuities) have surrender charges for early withdrawal of funds. Let’s say you sign up for a fixed index annuity with a 10-year term and put $20,000 into it. You’d be able to withdraw 10% of the money ($2,000) anytime without incurring any penalties. However, let’s say that after a year, you decide to pull all your money from the annuity. In this case, you’d have to pay a surrender charge. How big the surrender charge is depends on the annuity, the term, and a number of other factors. The table below shows typical surrender charges for a fixed index annuity. As you can see, it’s not unusual for you to incur a 10% surrender charge for pulling your money from a 10-year annuity.
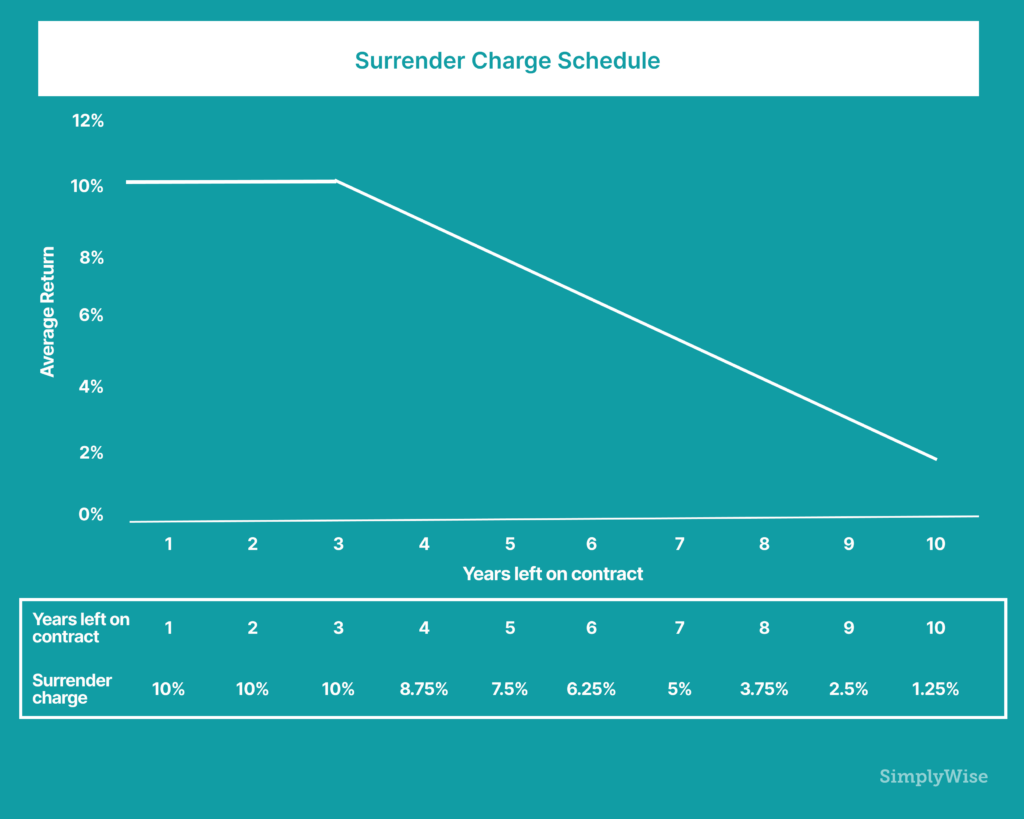
Why are the surrender charges for annuities so high? This is a result of how the middleman or annuity agent is compensated. When you buy an annuity, the insurer takes up to 10% of your money and pays the agent/broker who sold it to you. If, after a year, you decide to pull your money from the annuity, the insurer will give you your money back, but they have already paid the agent their compensation and can’t claw it back. The surrender charge that you pay helps cover the insurance company’s compensation obligations. We wrote more on surrender charges here.
Criticism of Fixed Index Annuities
Fixed index annuities have a negative reputation amongst commentators and personal finance gurus. This criticism is driven by the following observations about fixed index annuities:
- They pay high commissions to agents/brokers, which can be 5% to 10% of your money.
- They are complicated (annual point-to-point, caps, participation rates, spreads, etc.), so it’s hard to know what returns an investor should expect.
- They have steep surrender charges, so they aren’t liquid.
- Carriers can change the rates/rules annually at their will.
These criticisms are, for the most part, legitimate. The fixed index annuity has traditionally been more of an agent/broker-friendly product than a customer-friendly product.
As for the positives, a fixed index annuity does seem magical, and its value proposition of providing some market upside with no downside seems almost too good to be true. However, they are sold by highly commissioned agents/brokers who may not have your best interests at heart. The steep commissions provided by fixed index annuities are also the root cause for why the surrender charges on them are not customer-friendly. Furthermore, the complexity of the annuities makes it easier for customers to misunderstand what they are actually receiving when they hand over their hard-earned money to an insurance company.